Some time ago I posted an article about how temperature affects battery measurements. What I was curious about at the time was how much impact temperature had when measuring lead acid or AGM (absorbent glass mat) batteries, and it turned out that the effect was bigger than at least I had expected. The obvious question at the time was: What about lithium ion batteries? For a closer look at how temperature affects the measurement of LIBs my device under test was a Samsung INR18650-35E cell.
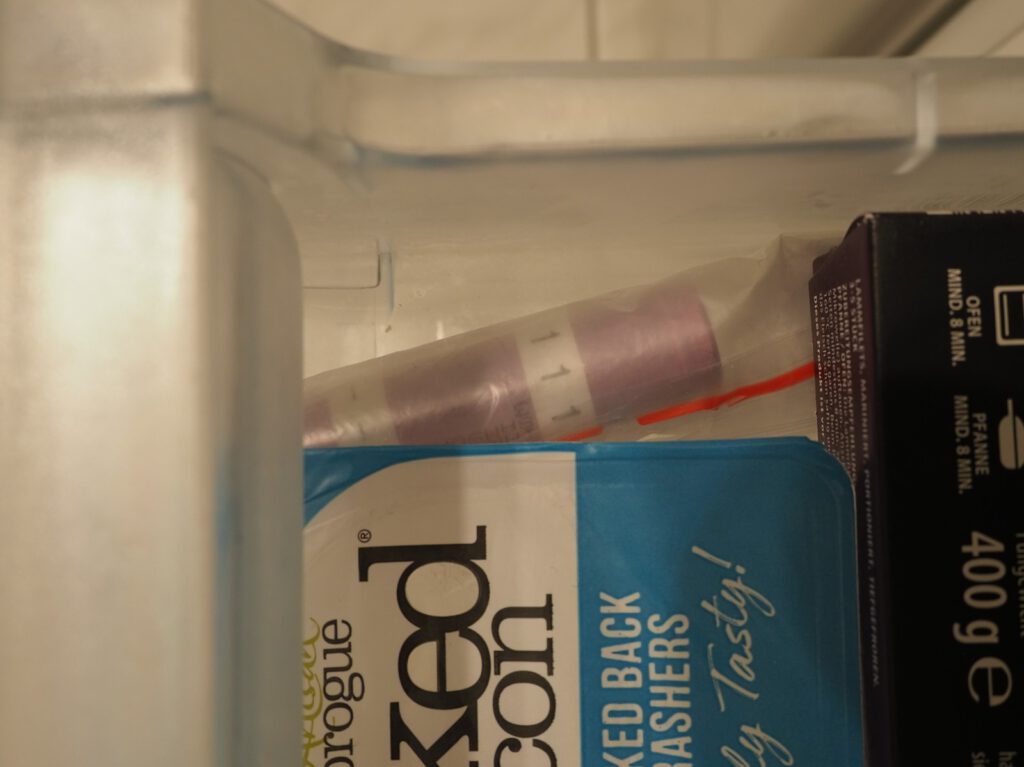
Like with the AGM test before I measured the LIB cell at room temperature (20°C), at fridge temperature (6°C) and at freezer temperature (-18°C). I did not use an industrial climate chamber for this test because I made this test at home. Instead the Samsung cell was chilled next to the bacon and the lamb in the freezer:
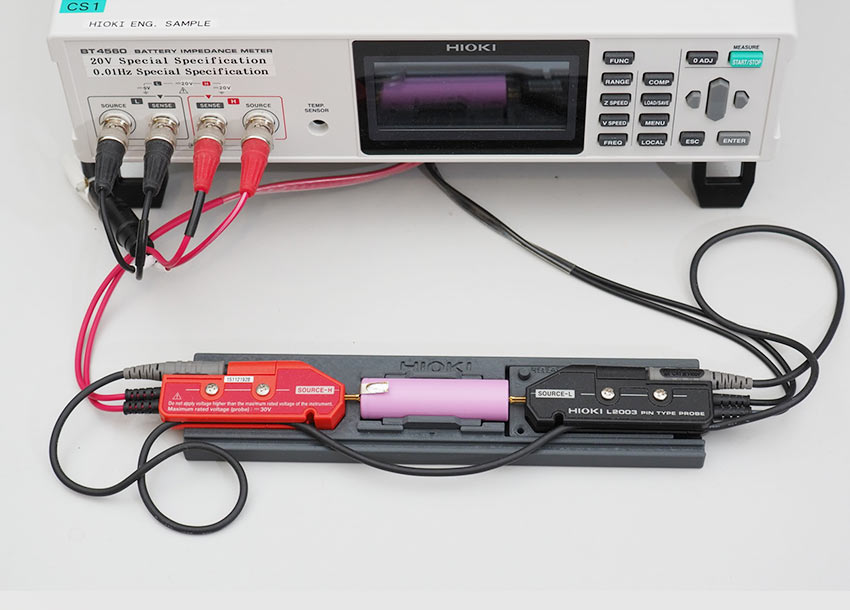
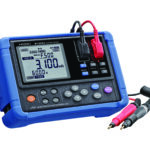
For each temperature the cell had at least 12 hours to “acclimatize” and the cell was fully charged. Unfortunately I didn’t make images of this exact measurement setup, but apart from a different 18650 cell it is the same as in this picture:
in the test I would remote-control the BT4560 via USB with a PC control software (comes with the instrument) which would sweep over a number of measurement points. You can manually set the number of measurement points as well as freely define the measurement frequency for each point. Alternatively you can tell the software how many points you want to measure and in which frequency range you want to sweep and the software automatically creates the list of frequencies to measure for you. However you do it, after the measurement sweep there is a list of measurement points which you can save as CSV or Excel file to process further. When testing the AGM battery I have created some Excel graphs manually out of the CSV files. However, since then our colleagues at HIOKI Japan have created a website called circuitfitting. It was primarily designed to provide a simple way of equivalent circuit fitting for battery cells, but it also has a multi-plot feature. Just choose “multi-plot”, upload your CSV files, and have your graphs in less than a minute.
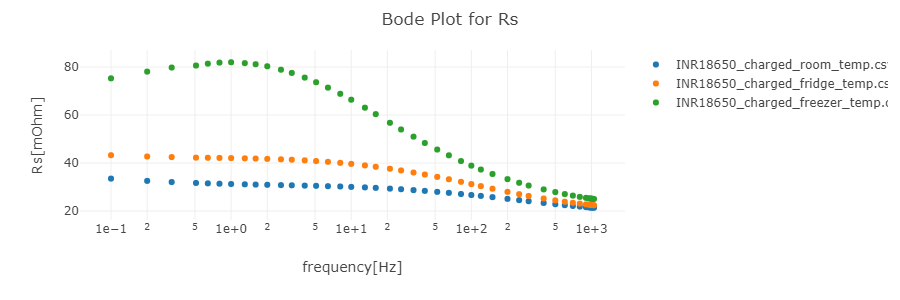
So here are the result graphs from my measurements – the first graph shows the measured resistance value over the frequency:
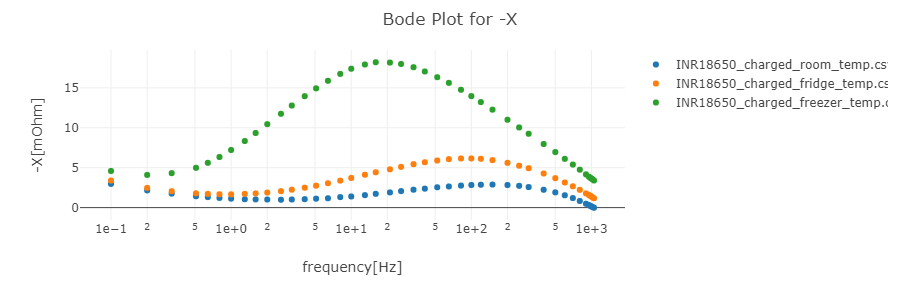
And here is the reactance over the frequency:
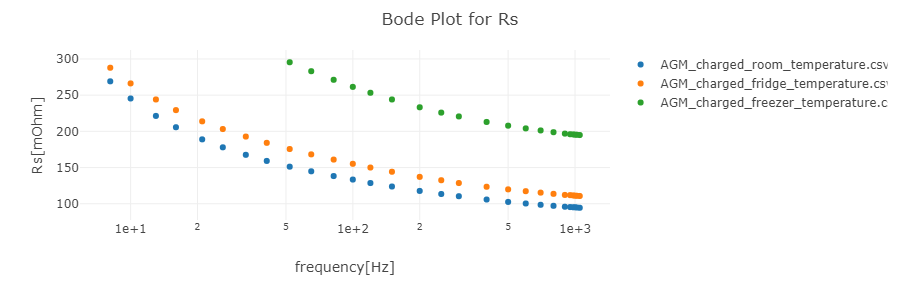
So, what’s the essence of these graphs? For me these graphs are a nice example that measuring lithium ion batteries is much more complex compared to lead acid or AGM batteries. Make the same measurement with an AGM battery and you get roughly three similar curves. I have re-used the old measurement data from the AGM test with circuitfitting.net to show what I mean. First, the resistance values:
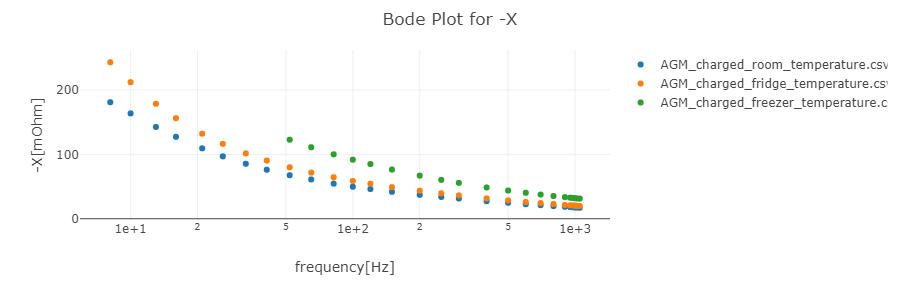
Like in the original post I also deleted some values which where so high or even out of range that they would eliminate a lot of details in the graph when formatting. The reactance plot looks like this:
So as you can see with the AGM battery you can just measure at one single frequency and you can kind of make a pretty educated guess of how the entire graph is going to look like. With the LIB cell that is much harder. So the message of this test is: When you measure LIBs at only one frequency then there might be things you are going to miss out on. At the same time, a typical battery tester like the BT3554 measures resistances at 1kHz and as with AGM cells you can also see how temperature affects the measurement values of LIBs when just looking at the 1kHz resistance value.