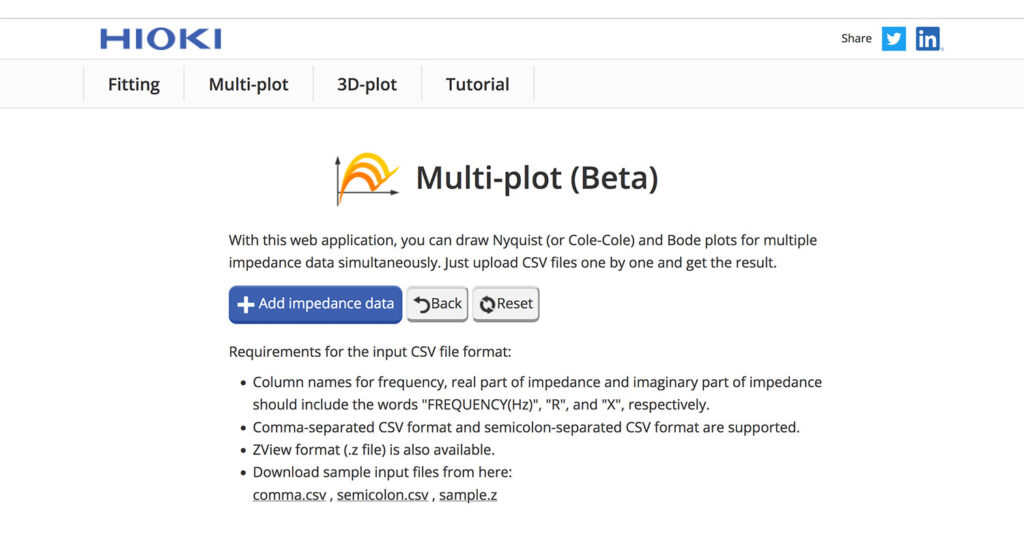
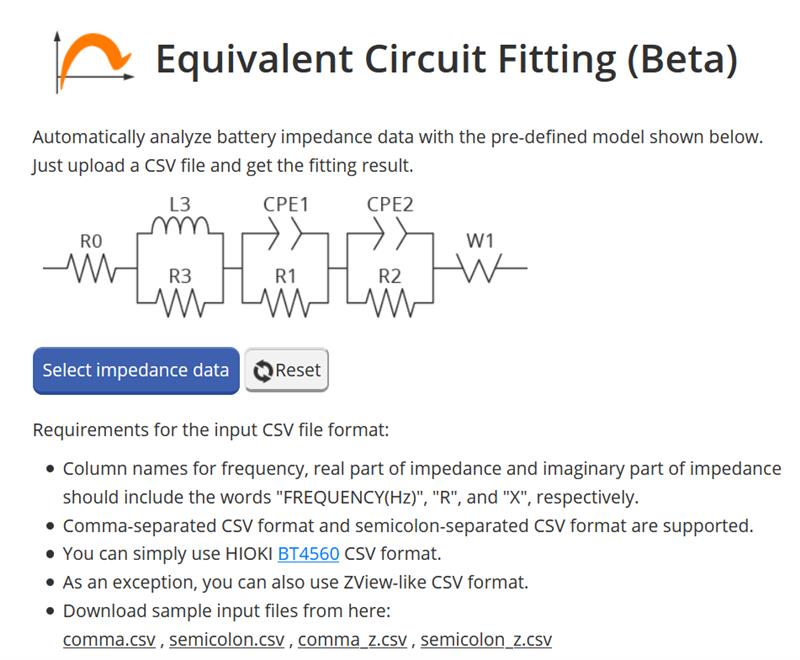
Measuring the impedance of a battery usually leads to a lot of data which then needs to be evaluated afterwards. When using a HIOKI BT4560 you can export a .csv file containing the data in a standardized format. That file is then loaded on this website my colleagues made:
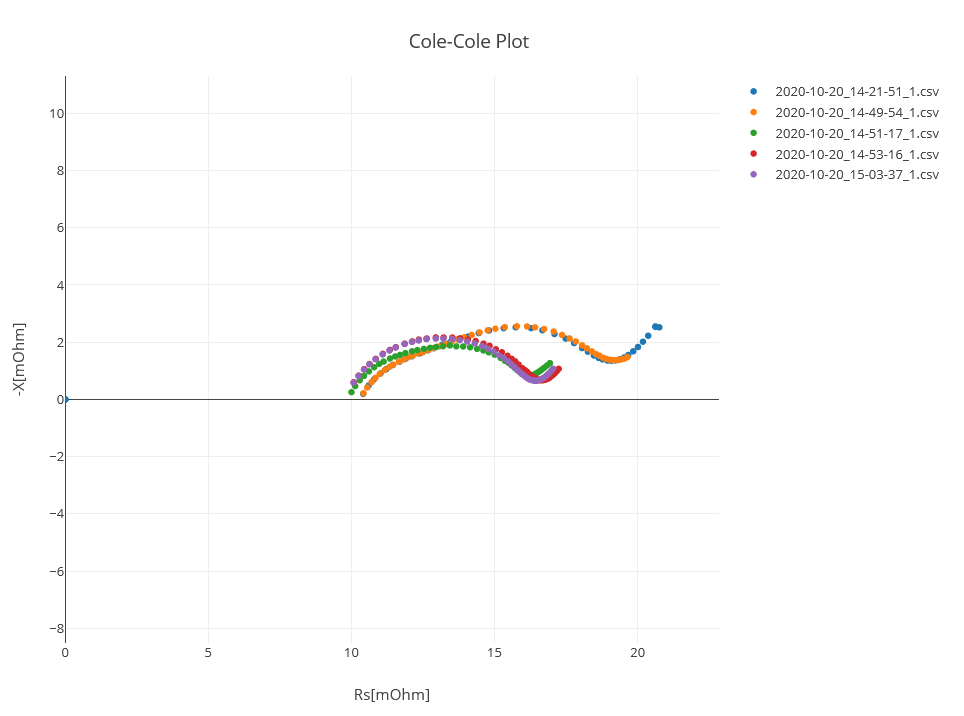
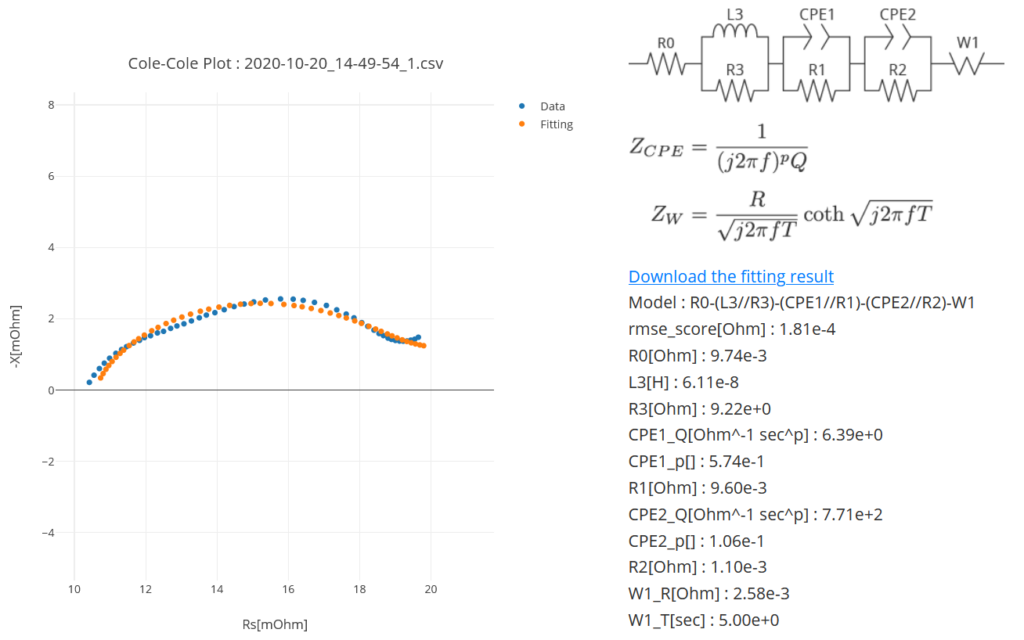
By clicking on “Add impedance data” you can chose the .csv file and load it. When comparing the results of several batteries you can repeat those steps and load the data from one battery to another. The output is the Cole-Cole plot like this:
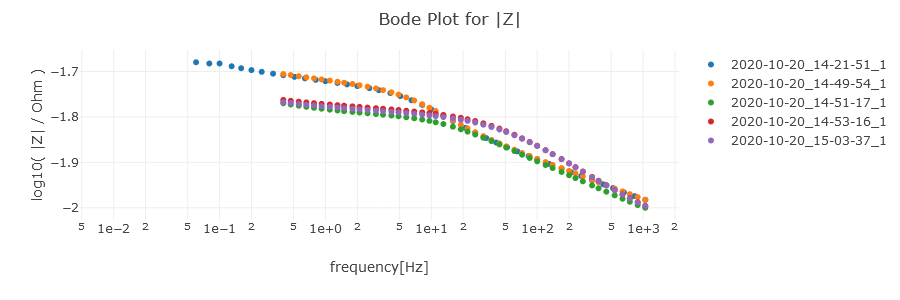
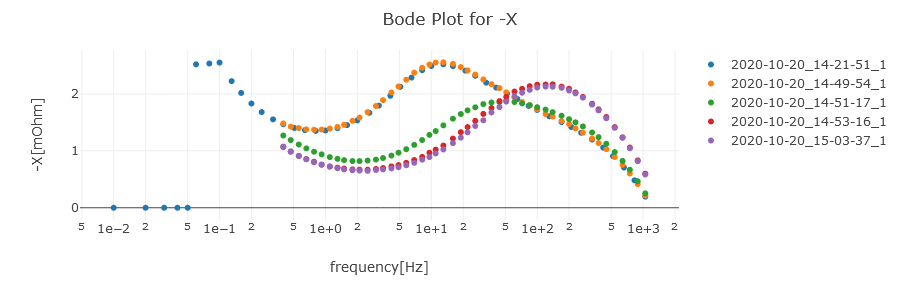
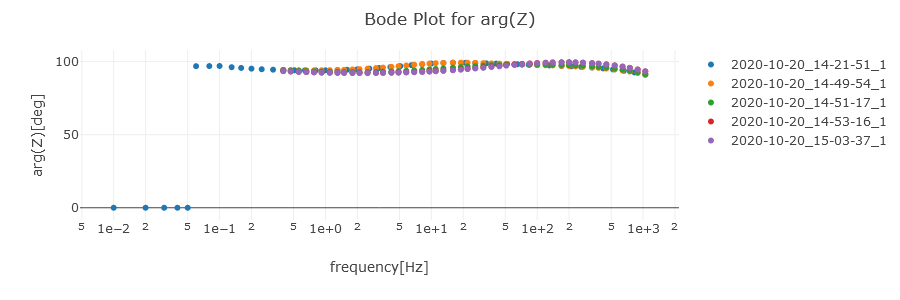
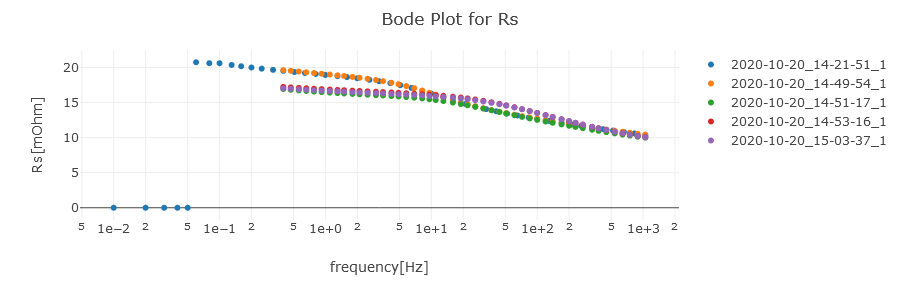
And the following four Bode plots:
Giving you a quick method to create graphs of your measurements for reports and presentations without manually loading them into an Excel sheet. If that didn’t convince you to give this website a try you should check out the fitting function which is also provided:
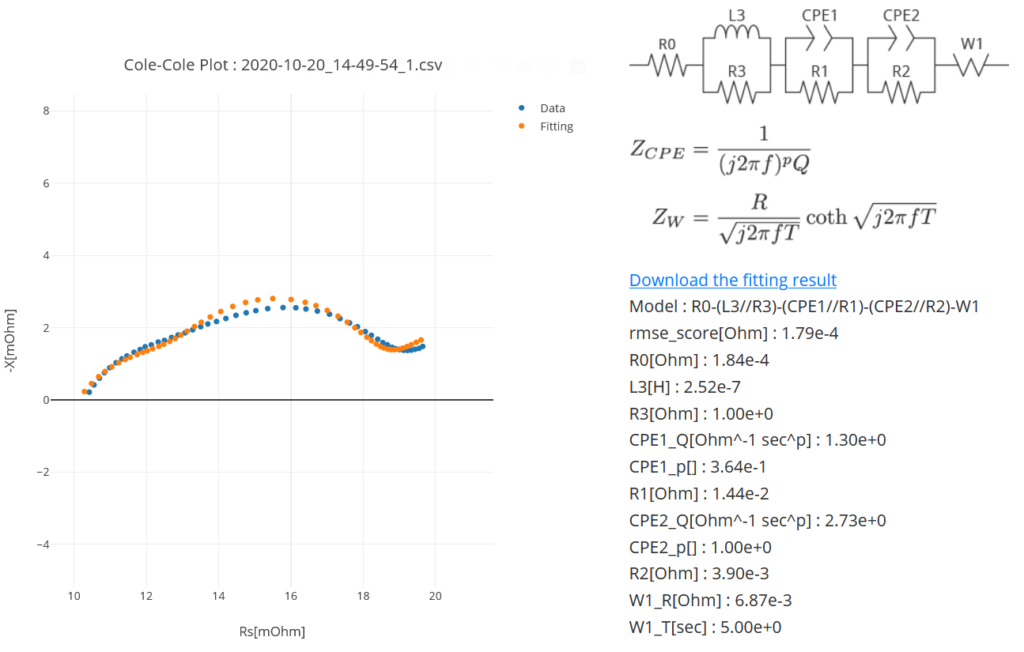
It’s as easy as it gets: click on “Select impedance data” and chose the file to load. The website then fits the equivalent circuit shown on the right of the graph to the measured data from the chosen .csv file and gives out the respective results:
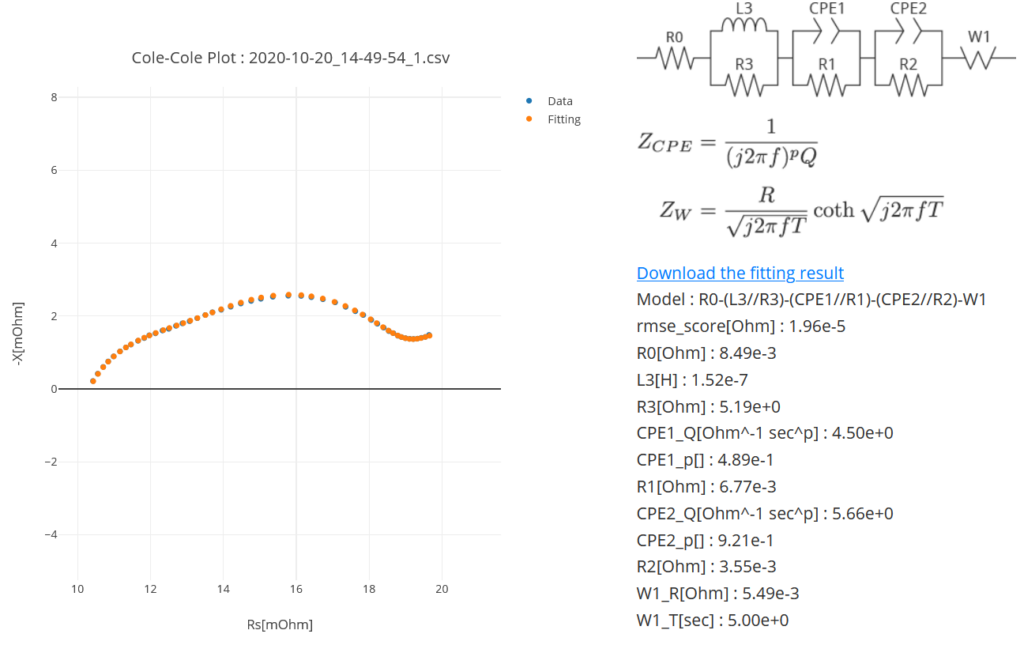
As the website and calculation model is still in its beta stage, please note that the fitted curve might not always match with the measured curve, as for example on the graph above. For that reason it might be worth giving it several tries. I tried three times in total and here’s what I got on the second and third:
On the last one I got a quite good match. In general I had the impression it works quite well but sometimes you might not get the right results, even after several tries. In the latter case I recommend you to come back and try again after some time, as this website is still under development and is being continuously improved by my colleagues. For example I’ve heard of the plan to implement more equivalent circuits from which you can choose the one you think fits best to your particular application.