Whenever you visit a shopping center or cinema or basically any public building you might notice illuminated emergency exit signs telling you the way out in case of an incident. As such an incident might cause the mains power supply to stop working, at least in Europe there are requirements that these emergency exit lights need to keep running with a backup battery that is typically inside the light unit itself. Of course it’s not enough that these lights exist – they also need to be regularly inspected. In Europe, the batteries used in these systems are required to be tested annually as described in EN 50272-2 (EN is short for European Standard).
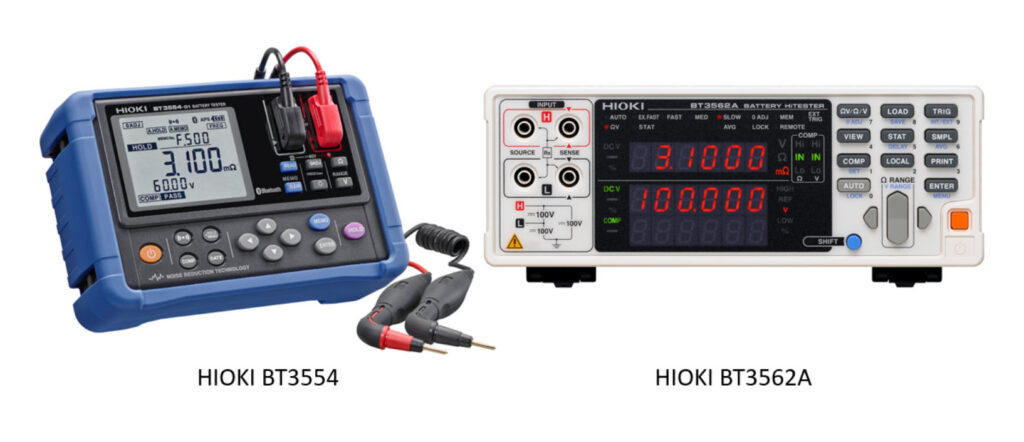
Of course this standard is not limited to batteries in emergency exit signs: Batteries in relevant UPS systems, for example, also need to be inspected regularly. Today, lead acid batteries are still the common battery type for these UPS systems, and a very popular battery tester for such inspections is HIOKI’s BT3554 battery tester. I won’t go into details about this tester because I’ve written a couple of posts before which mentioned this tester (in the article “How temperature affects battery measurements“).
So why should the effectiveness of its AC resistance measurement principle be limited for lithium ion batteries when the measurement technology is used in production tests of exactly those batteries?
Battery testers using the AC measurement method typically work with a single, fixed frequency. According to IEC 61960-3:2017, battery production tests require an AC resistance measurement at 1kHz. That’s why AC resistance battery testers typically use 1kHz as fix frequency.
But when measuring lithium ion batteries other frequencies also offer information about a cell or battery. Therefore, to get all possible information from a lithium ion cell or battery it is not enough to just measure at a single, fix frequency. Instead, a sweep over a frequency range is required, which for lithium ion cells is typially between 0.1 Hz and 1 kHz. The correct term for this “impedance measurement sweep” is “Electrochemical Impedance Spectroscopy” (EIS). One of the most common equivalent circuit diagrams used to interpret an impedance spectrum of a lithium ion cell with regards to EIS is the Randles circuit:
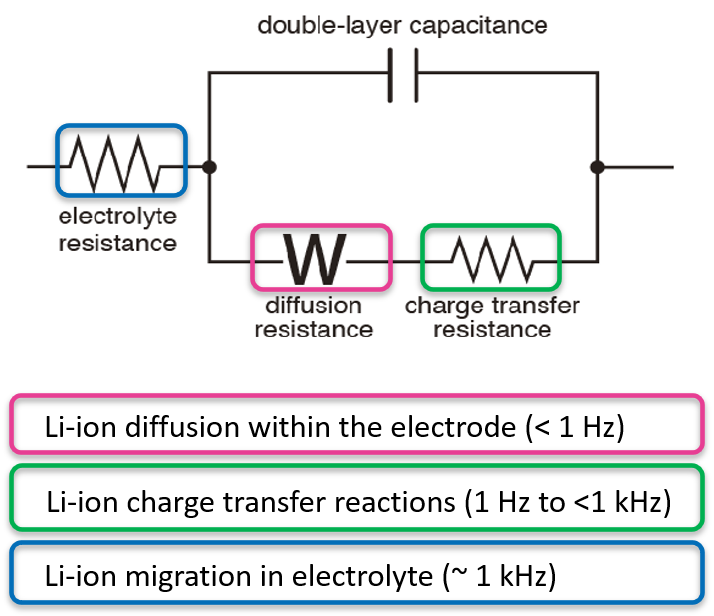
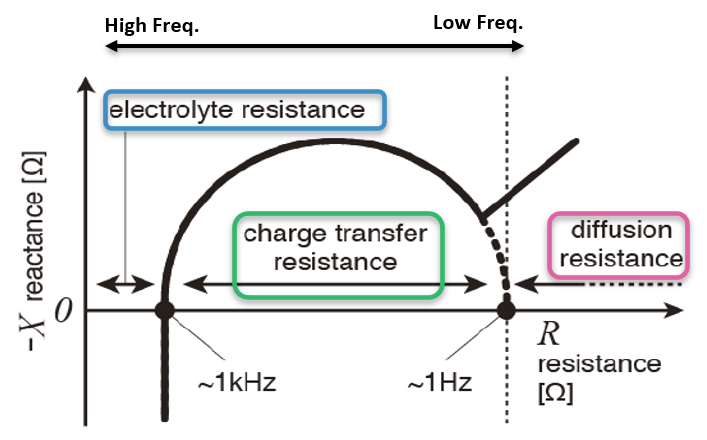
As you can see there are three types of informations that can be extracted from a lithium ion cell using EIS:
- The lithium-ion diffusion within the electrode (the “W” in the above diagram stands for “Warburg element“) when looking at frequencies below 1 Hz. The electrode in a new battery has been already checked very early in the battery production process – for example by using a special resistance meter like the HIOKI RM2610. So unless the cell is for a high performance application like in a racing car – where cell grading would be done – there is no real need to test this frequency range with a battery tester.
- The lithum-ion charge transfer reaction when looking at frequencies between 1 Hz and a few hundreds of Hz. This is the relevant frequency range when gathering information about the State of Health (SoH) of a cell. At the same time it is not super important to perform a measurement in this frequency range in production – because the SoH is not relevant when making new cells. Again, grading might be a reason to make this measurements also in production, but this is done with a tiny amount of typically high capacity cells.
- The lithium-ion migration in electrolyte when looking at frequencies of around 1 kHz. This is something that should be tested in production. Because it tells whether the electrolyte filling has been done properly and it also tells about connection resistances which shouldn’t be there. That’s why this is an important test frequency in production.
The result of an EIS is typically presented in a Nyquist plot (in Asia the term “Cole-Cole plot” is more common):
Lets look at this a little less abstract and simply compare a Nyquist plot for a new lithium ion cell with a plot of a degraded cell:
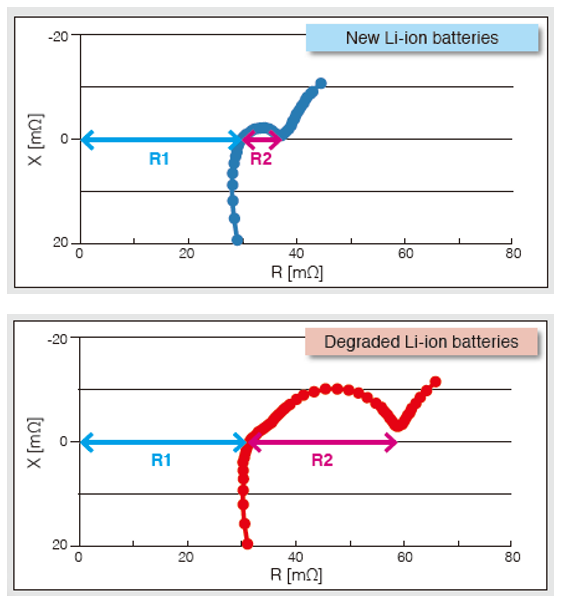
R2 in the above graphs is the charge transfer resistance which is measured when looking at frequencies between 1 Hz and some hundred Hz. As you can see this value can tell us about the State of Health of the cell. R1 is the measurement information which you will get when measuring at 1 kHz. If you compare the above graphs then you can see that the difference in values of R1 is rather small. Therefore it is very hard to make a judgement about the State of Health of a lithium ion battery with the 1 kHz measurement value alone.
To be able to make any judgement based on R1 you would also need a very precise measurement instrument:
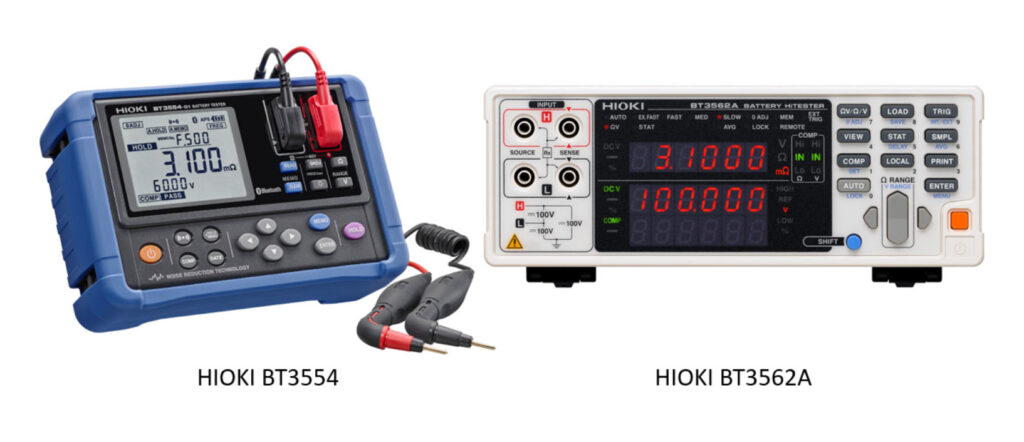
If you wonder why I copied the above image into this post again: Just look at the resistance values of the two testers – the BT3562 has a resolution which is 10x higher than the BT3554. So you can read much more out of R1 when measuring with the BT3562. But that is a production instrument which is not suitable for maintenance measurements (it is AC powered).
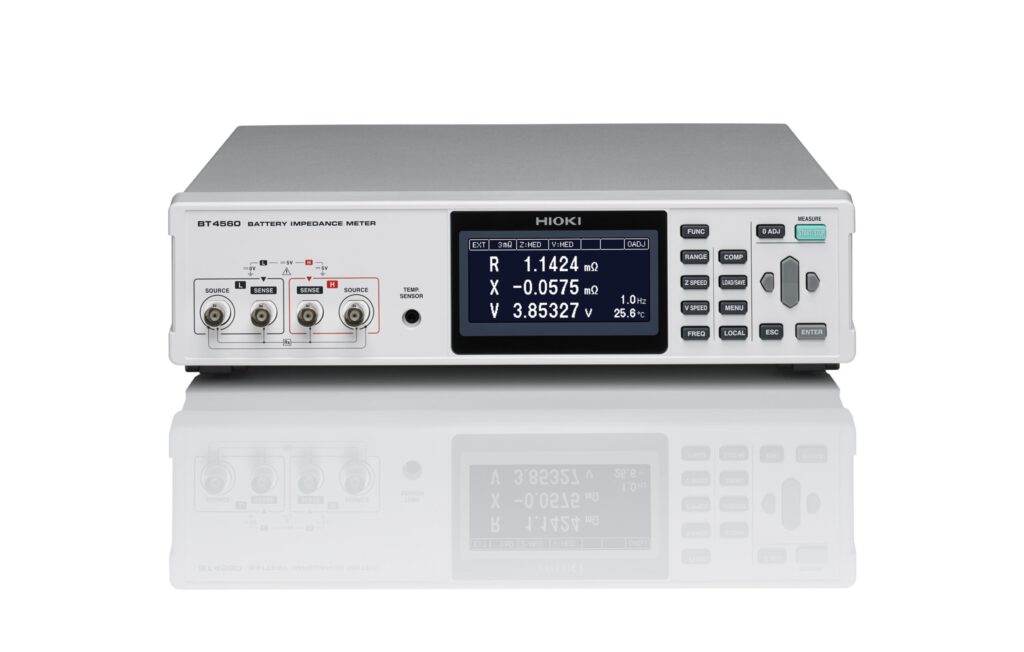
The above measurements have been made with another HIOKI instrument – the BT4560 Battery Impedance Meter:

The portable BT3554 is based on the bench tester BT3562 – why not create a portable model out of the BT4560 and make EIS measurements that allow to judge the State of Health of lithium ion batteries? First, EIS is something that is typically performed on cell level. Therefore you would need access to every single cell. This might be possible when inspecting an emergency exit sign where the backup battery might be just a single 18650 or 21700 cell, but it is much harder when inspecting a UPS system with a lot of cells connected in series. Also, when measuring series of lithium ion cells you always have to consider the BMS / protection circuits – because they do have an impact on the measurement result.
The most important reason in my view why you wouldn’t want to perform an EIS in a maintenance measurement ist the time it takes: The BT3554 performs a single 1 kHz measurement in 2 seconds. A measurement at 1 Hz will take significantly longer, and a sweep from 1 Hz to 1 kHz – even with much less measurement points than in the graphs above – will take a lot longer again. Imagine you are the maintanance technician performing those inspections and you have to ensure that there is perfect and continous contact between the measurement probe and the cells for half a minute per cell. In a good scenario you might stand on a ladder to reach the single lithium ion cell in the emergency exit light while holding tight during the EIS. In a bad scenario you might be crammed somewhere in a tight UPS system with 200 cells connected in series to measure, because the voltage of the system is 700 VDC.
Lets summarize this: 1 kHz measurements on lithium ion batteries only really tell us about the state of the electrolyte of a cell but not a lot about it’s actual State of Health. At the same time this is exactly what we want to measure when making maintenance measurements on batteries in the scenarios from the beginning of this post. For lead-acid batteries the 1 kHz measurement is perfect to find out about the State of Health as the resistance at 1 kHz increases pretty constantly when the cell deteriorates over time / usage. But especially for maintenance measurements on LIBs the 1 kHz measurement only provides limited information.

